
 Srpski
 Български
 Polski
 Hrvatski
 Čeština
 简体中文
 Deutsch
 Español
 Français
 Italiano
 Português
 Nederlands
 Svenska
 Slovenčina
 Türkçe
 Українська
HPLC purity: what a single percentage does not tell you
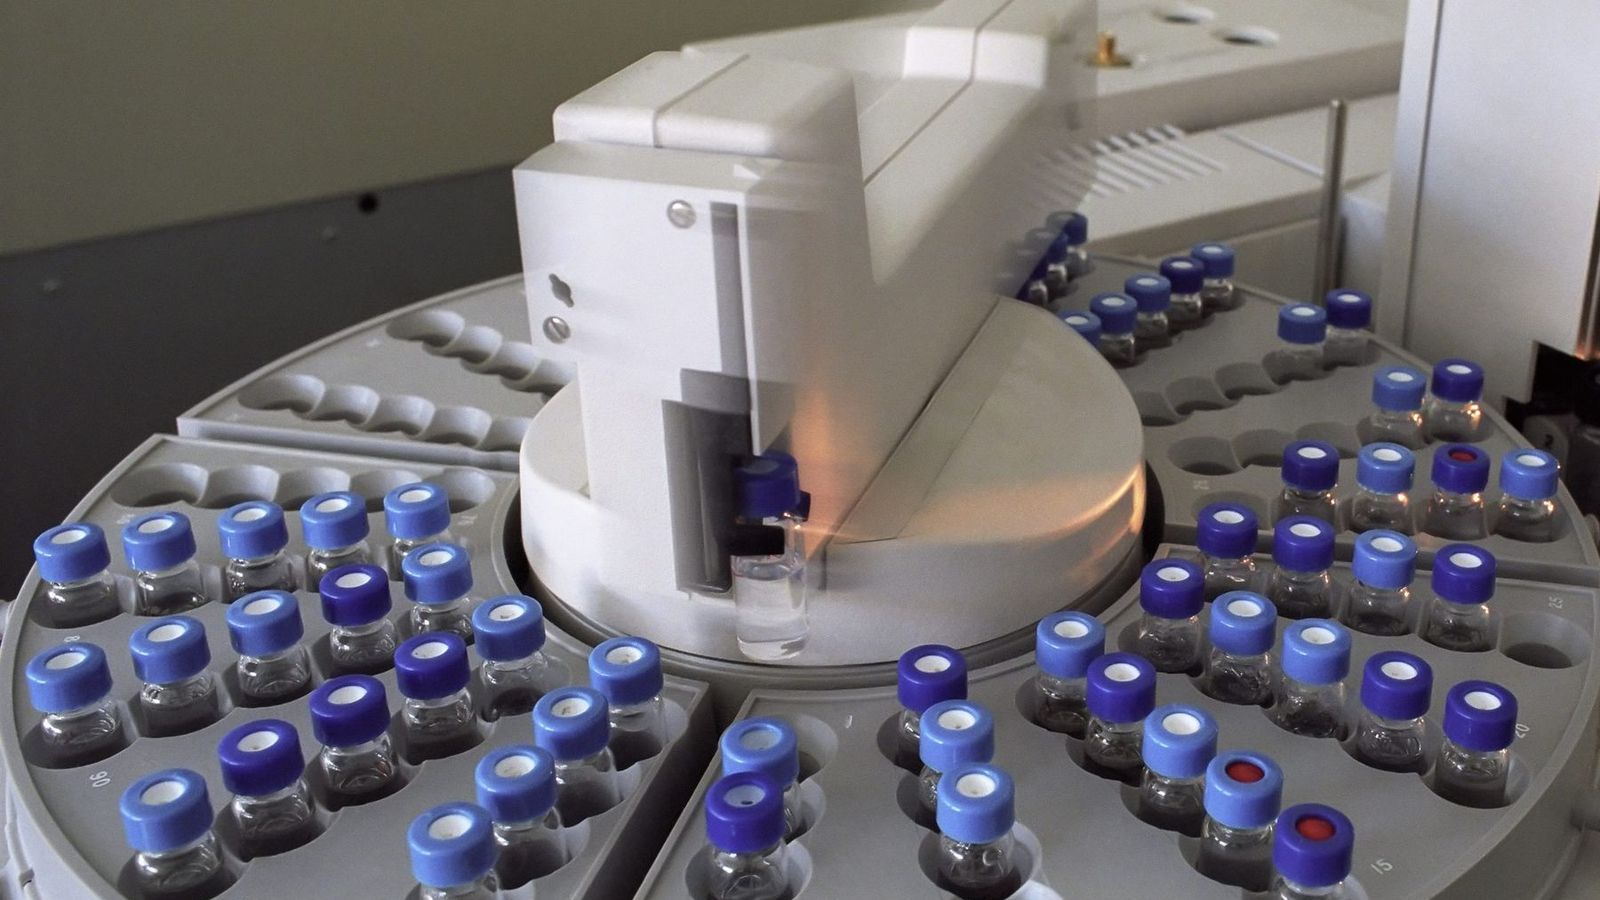
On almost every certificate of analysis for a peptide, the first figure is HPLC purity: 98%, 99%, sometimes even 99.9%. It is useful information, but it describes only one aspect of quality. To know what it means, you need to know how it is obtained.
How HPLC measures purity
HPLC (high-performance liquid chromatography) separates molecules as they pass through a column packed with fine particles. For peptides, a reversed-phase column, designated C18, is most commonly used. A mixture of water and acetonitrile with a little trifluoroacetic acid flows through it, and the proportion of acetonitrile increases during the analysis. This is called a gradient. Peptides separate according to how hydrophobic they are: those that like water less are retained longer in the column.
At the column outlet there is a UV detector, usually set to 214 to 220 nm, the wavelength at which the peptide bond itself absorbs light. The result is a chromatogram, a line with peaks. Each peak is one substance, and the area of a peak roughly corresponds to its amount.
Purity is the area of the main peak as a share of the sum of the areas of all peaks. If the main peak makes up 98% of the total area, the purity is 98%.
First: purity does not prove identity
HPLC shows that one substance dominates the sample, but not which substance it is. A perfectly clean peak can be the wrong peptide. Identity is confirmed by another method, mass spectrometry, which measures the mass of the molecule. That is why a serious certificate always contains both results.
Second: purity is not quantity
HPLC compares the peptide only with what the UV detector sees. There is a lot in the vial that the detector does not see:
- water left over after lyophilisation,
- counterions, that is, trifluoroacetate or acetate bound to the peptide,
- salts and excipients such as mannitol.
So a peptide can have a purity of 99% while the peptide chain itself makes up a smaller part of the total mass of the powder. This share is called the net peptide content and is measured by separate methods, for example amino acid analysis or nitrogen determination. For synthetic peptides, the net content is usually between 70 and 90%. This is not a flaw but chemistry: after purification, the peptide carries its counterions and some water.
For the same reason, some reports state, in addition to purity, the measured amount of peptide in the vial compared with the declared amount.
Third: the result depends on the method
Two laboratories can obtain different percentages for the same sample, and both can be right. The result depends on:
- The column and gradient. A fast method separates less well. An impurity that elutes together with the main peak stays hidden inside it and raises the purity. A longer method separates better and usually gives a somewhat lower but more trustworthy figure.
- The wavelength. Some impurities absorb light differently from the peptide.
- Integration. Where the baseline is drawn and which small peaks are counted changes the final figure, especially when integration is done manually.
- The reference standard. Comparison with a pure standard of the same peptide confirms where the peak lies. Without one, the conclusion is indirect.
It is not unusual for the same sample to show over 99% with a fast method and a few percent less with a longer, more precise one. That does not mean the peptide deteriorated between the two analyses, only that the methods differ.
What a good HPLC report looks like
- The method is stated, ideally including the column, gradient and wavelength.
- The chromatogram with a peak table is attached, or can be obtained on request.
- The batch number on the report matches the batch number on the vial.
Besides purity and identity, tests for endotoxins, heavy metals and microbiological purity complete the picture. You can view or request the results for our batches on the Certificates page.
View catalog